Note
Go to the end to download the full example code
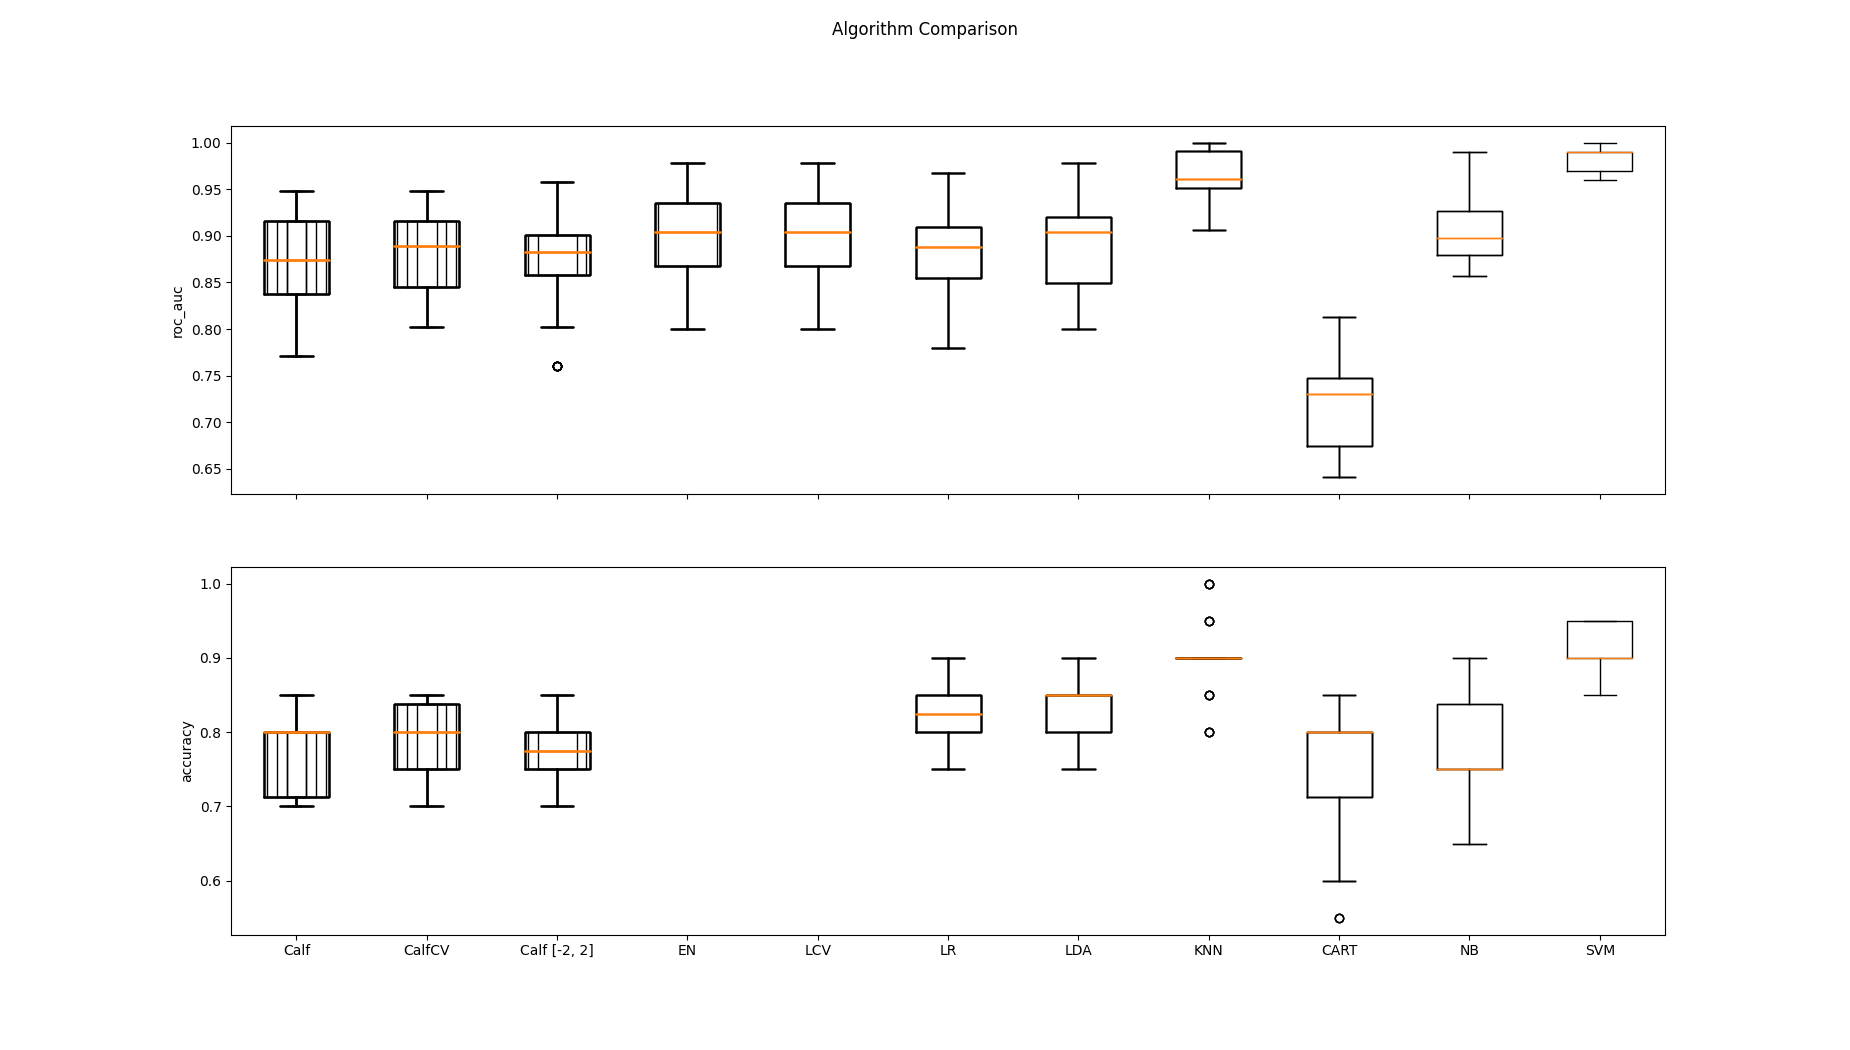
CalfCV comparison plot
A classifier comparison plot including Calf and CalfCV.
Using the grid [-2, 2] with Calf improves performance by
increasing the AUC mean and reducing variance.
import warnings

import matplotlib.pyplot as plt
from sklearn.datasets import make_classification
from sklearn.discriminant_analysis import LinearDiscriminantAnalysis
from sklearn.linear_model import LassoCV, ElasticNetCV
from sklearn.linear_model import LogisticRegression
from sklearn.model_selection import cross_val_score, KFold
from sklearn.naive_bayes import GaussianNB
from sklearn.neighbors import KNeighborsClassifier
from sklearn.preprocessing import StandardScaler
from sklearn.svm import SVC
from sklearn.tree import DecisionTreeClassifier

import numpy as np

from calfcv import Calf, CalfCV

warnings.filterwarnings("ignore")

# Make a classification problem
X, y = make_classification(
    n_samples=200,
    n_features=20,
    n_informative=10,
    n_redundant=5,
    n_classes=2,
    random_state=11
)
scaler = StandardScaler()
X = scaler.fit_transform(X)

# Models to be compared
# ElasticNetCV and LassoCV are expected to fail using the accuracy metric
# Here we show the versatility of Calf and CalfCV under both accuracy and auc.
models = [
    ('Calf', Calf()),
    ('CalfCV', CalfCV()),
    ('Calf [-2, 2]', Calf(grid=np.arange(-2, 2, .1))),
    ('EN', ElasticNetCV()),
    ('LCV', LassoCV()),
    ('LR', LogisticRegression()),
    ('LDA', LinearDiscriminantAnalysis()),
    ('KNN', KNeighborsClassifier()),
    ('CART', DecisionTreeClassifier()),
    ('NB', GaussianNB()),
    ('SVM', SVC())
]

names = [x for (x, _) in models]
kfold = KFold(n_splits=10)
fig, (ax1, ax2) = plt.subplots(2, sharex=True)
fig.suptitle('Algorithm Comparison')

# evaluate each model in turn against metrics auc and accuracy
plot_info = [('roc_auc', ax1), ('accuracy', ax2)]
for score, ax in plot_info:
    results = []
    for name, model in models:
        # Lasso and ElasticNet will fail using accuracy
        try:
            cv_results = cross_val_score(model, X, y, cv=kfold, scoring=score)
            results.append(cv_results)
            ax.boxplot(results)
            ax.set_ylabel(score)
        except ValueError:
            pass

ax2.set(xticks=range(1, len(models) + 1), xticklabels=names)
fig.set_size_inches(18.5, 10.5)
plt.show()
Total running time of the script: ( 0 minutes 59.896 seconds)