Note
Go to the end to download the full example code
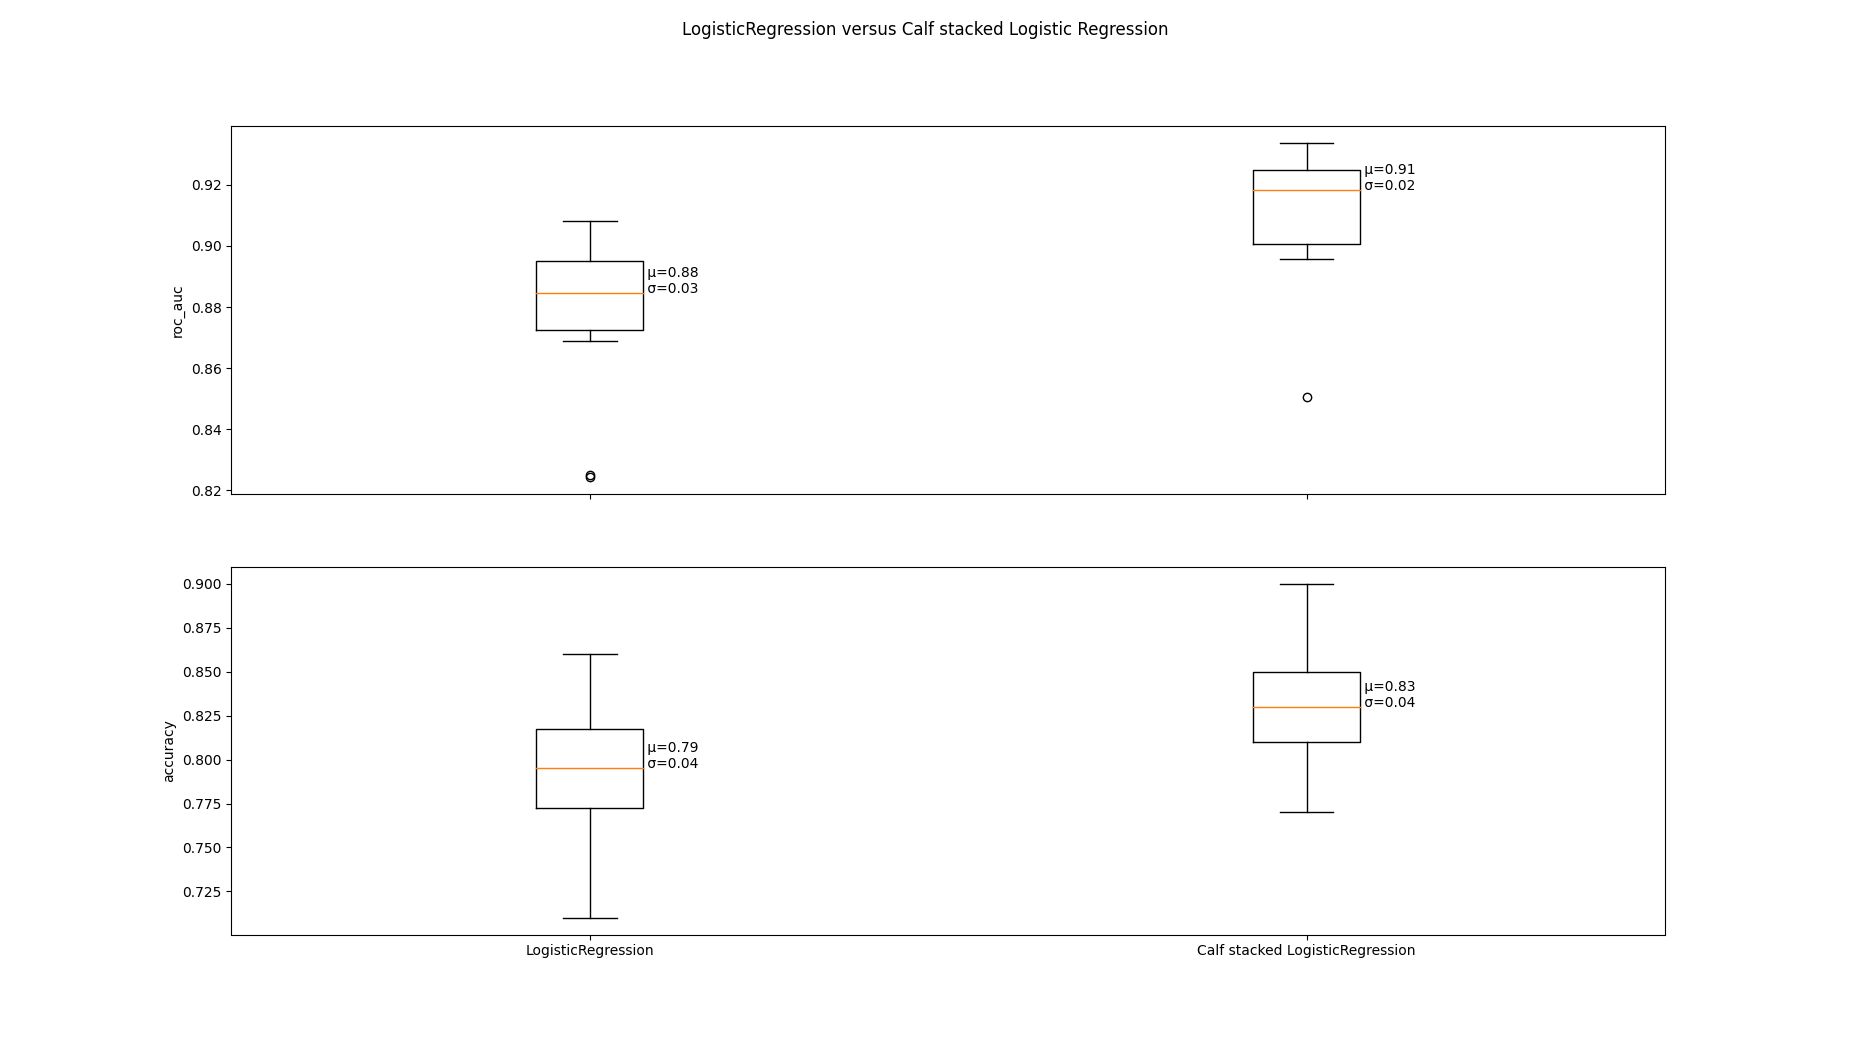
Calf stacked LogisticRegression Plot
A classifier plot comparing LogisticRegression to Calf
stacked LogisticRegression. Stacking with Calf increases the mean AUC
and can reduce variance.
Author: Rolf Carlson, Carlson Research LLC, <hrolfrc@gmail.com> License: 3-clause BSD
import warnings

import matplotlib.pyplot as plt
import numpy as np
from sklearn.datasets import make_classification
from sklearn.linear_model import LogisticRegression
from sklearn.model_selection import cross_val_score, KFold
from sklearn.pipeline import Pipeline
from sklearn.preprocessing import StandardScaler

from calfcv import Calf

warnings.filterwarnings("ignore")

# Make a classification problem
X, y = make_classification(
    n_samples=1000,
    n_features=200,
    n_informative=20,
    n_redundant=10,
    n_classes=2,
    random_state=11
)

calf_lr = Pipeline(
    steps=[
        ('scaler', StandardScaler()),
        ('calf', Calf()),
        ('lr', LogisticRegression())
    ]
)

# Models to be compared
# ElasticNetCV and LassoCV are expected to fail using the accuracy metric
# Here we show the versatility of Calf and CalfCV under both accuracy and auc.
models = [
    ('LogisticRegression', LogisticRegression()),
    ('Calf stacked LogisticRegression', calf_lr)
]

names = [x for (x, _) in models]
kfold = KFold(n_splits=10)
fig, (ax1, ax2) = plt.subplots(2, sharex=True)
fig.suptitle('LogisticRegression versus Calf stacked Logistic Regression')

# evaluate each model in turn against metrics auc and accuracy
plot_info = [('roc_auc', ax1), ('accuracy', ax2)]
for score, ax in plot_info:
    results = []
    for name, model in models:
        try:
            cv_results = cross_val_score(model, X, y, cv=kfold, scoring=score)
            results.append(cv_results)
        except ValueError:
            pass

    res = np.array(results)
    m1 = res.mean(axis=1)
    st1 = res.std(axis=1)

    bp = ax.boxplot(results)
    for i, line in enumerate(bp['medians']):
        x_text, y_text = line.get_xydata()[1]
        text = ' μ={:.2f}\n σ={:.2f}'.format(m1[i], st1[i])
        ax.annotate(text, xy=(x_text, y_text))
    ax.set_ylabel(score)

ax2.set(xticks=range(1, len(models) + 1), xticklabels=names)
fig.set_size_inches(18.5, 10.5)
plt.show()
Total running time of the script: ( 0 minutes 14.523 seconds)